Q4 2024 insurance asset allocation – adapting to a dynamic macroeconomic and geopolitical environment
As we approach the end of 2024, insurance asset allocators face significant challenges due to evolving macroeconomic conditions, credit markets, and geopolitical uncertainties. In addition to these familiar topics, emerging risks such as climate, ESG, and cyber are increasingly appearing near the top of an insurer’s list of strategic priorities.
Divergent views on how aggressively “higher for longer” monetary policies will be unwound creates uncertainty for corporate balance sheets and associated divergence in credit risks across segments and firms.
Geopolitical risks — including policy change that may flow from the US election outcome and conflicts in the Middle East and Ukraine — amplify this uncertainty. Regulatory changes, such as adjustments the NAIC is making to how it treats credit ratings and some alternative credit assets in the calculation of RBC capital, will require insurers to adapt their asset allocation strategies.
In this dynamic landscape, insurers can leverage adaptable and responsive models and analytics to enhance their asset allocation and risk management framework.
This report considers the evolving macro environment and uses an example to consider how asset-liability modeling and analysis can be used to balance yield, duration, and credit risk to optimize portfolios. By understanding the impact of different macroeconomic scenarios and emerging risks, insurers can navigate the complexities of the current market to help achieve their financial objectives.
A complex and evolving risk environment
As we approach the end of 2024, evolving macro conditions and uncertainty are impacting the way insurers review and optimize strategic asset allocations:
- While tight monetary policy through 2023 helped bring inflation down to more sustainable levels, making it over the final hurdle to hit 2% targets has proven harder. The consequence for markets has been a “higher for longer” macro environment, with central banks maintaining raised policy rates through the first half of 2024.
- However, with headline inflation now down around target, policymakers have begun to loosen policy through Q3 2024. Both market implied and consensus forecasts suggest further and potentially faster reductions in policy rates. Figure 1 shows a summary of consensus forecasts for the US and UK.
- Consensus forecasts (Figures 1b and 1d) and market implied rates suggest bond yields have already priced in much looser monetary policy. Expectations are for significant flattening of the yield curve over the next 12 months.
Figure 1: Consensus forecasts and range (end-year 2024 to end-year 2034)
Figure 1a. US Treasury 3-month rate Figure 1b. US 10-year Treasury bond yield
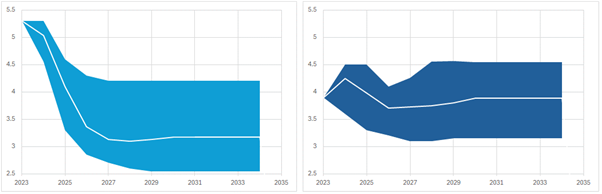
Figure 1c. UK government 3-month rat Figure 1d. UK 10-year Gilt yield
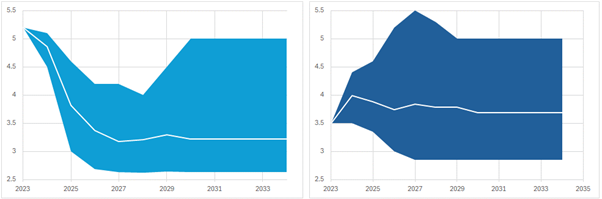
Source: Consensus Forecasts, Survey of International Economic Forecasts, July 8, 2024
Impact on corporate balance sheets and credit risk
- Overall, corporate balance sheets have remained robust; the US and developing economies have been able to defy gravity for what looks like a soft landing.
- For larger liquid investment grade corporate issuers, Moody’s credit outlook has seen falling default rates through 2024. Spreads remain tight relative to historic levels (Figure 2). The performance hurdle for corporate bonds remains high, but for insurers who can invest on a buy-and-hold basis, a higher-for-longer central bank policy has made for high yields despite these low spreads.
Figure 2: Spreads have continued to trend down through 2024
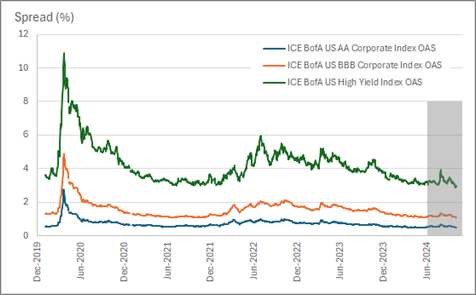
Source: ICE BofA Option-Adjusted Spreads
- However, smaller, less well-capitalized businesses in rate-sensitive, cyclical sectors appear subject to increasing default risk. And with spreads low, insurers need to be particularly careful navigating the higher yield market and managing the associated downside risks.
- In this environment, central banks are balancing remaining inflationary pressure in parts of the economy, with the risk that too much caution in loosening policy might push key segments of the economy into a slowdown or recession.
Geopolitical risks create more uncertainty in the macro scenarios
- This underlying macroeconomic uncertainty is being amplified by a multitude of geopolitical risks — the US election outcome with consequences for trade and immigration policy, as well as supply and price stress arising from escalations in the Middle East and Ukraine.
- Insurance asset allocators must manage asset portfolios to persevere throughout the potential capital market scenarios that may result. The modeling and analytics insurers rely upon to inform their strategic investment decisions need to be adaptable and responsive as situations evolve.
Moving regulatory goalposts
- In addition to this macro and geopolitical uncertainty, prudential regulators continually review their solvency capital frameworks to make sure these adequately reflect risks run by insurers. Much of this focus is on the asset side of the balance sheet, where insurers look to exploit emerging and often complex investment opportunities, notably in the private market and structured credit sectors.
- As an immediate example, the National Association of Insurance Commissioners (NAIC) is increasing the number of credit rating classifications used to define capital charges from six to 20; also adjusting how it treats structured credit. This is likely to require an extension to the return on capital metrics used to inform insurers’ strategic asset allocation decisions and may incentivize insurers to adjust asset allocation strategies.
Challenges and opportunities for insurance asset allocators
- This uncertain macro and geopolitical environment creates complex questions for insurers reviewing and reoptimizing asset allocation strategies, particularly focusing on credit.
- One useful feature of the current market is a yield curve for high-quality US corporate bonds (AAA-A) that is less inverted than for Treasuries (Figure 3). Investors in longer-dated corporates are not sacrificing yield to the same extent as Treasury investors.
Figure 3: Longer-duration investment-grade corporates have offered yields as high as Treasury bills
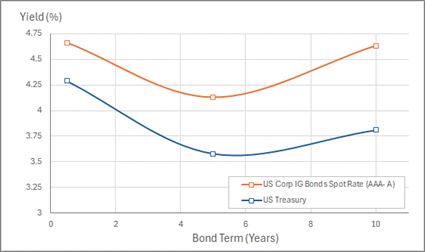
Sources: US Dept of the Treasury, High Quality Market (HQM) Corporate Bond Spot Rate and US Fed Reserve, Market Yield on U.S. Treasury Securities at Constant Maturity
- Given this market dynamic, cash flow-focused “buy and hold” investors like insurers may be considering transition to longer-duration investment-grade corporates; reducing asset-liability risks and maintaining or even increasing yields. This contrasts with shorter-dated bonds that will expose insurers’ reinvestment risk as rates begin to fall.
- The “higher for longer” macro environment means many insurers are holding bonds at discount to par — an opportunity to harvest the losses on these bonds to reduce taxable earnings, reinvest into assets at higher yield, diversify into alternative credit classes, and better align their strategic asset allocations with asset-liability objectives.
Analysis to review and re-optimize the asset allocation through macro and geopolitical uncertainty
The current macro environment is complex and risky. Uncertainty remains regarding the timing and speed of yield curve reversion, how credit risks will evolve across different segments of the market, and how geopolitical events will continue to impact global capital markets. In this context, insurers and their investment partners need access to models and analytics that will help them make responsive strategic investment decisions.
Asset strategies that may seem optimal on an instantaneous or “point in time” basis need to be implemented in practice. That means rebalancing portfolios — potentially selling assets — through a period of significant capital market flux.
To make informed decisions regarding changes to their asset allocation, insurers should use tools that capture these risks and allow them to evaluate, compare, or optimize asset strategies in a way that reflects their own financial objectives and risk profiles.
- Analysis of asset allocations should account for the required rebalancing, capturing the book value position of individual securities and the impact on taxable gains and losses.
- Use scenarios that accurately reflect uncertainty in future yield curve and credit spread dynamics to evaluate how different strategic asset allocation plans are exposed to different macro outcomes.
- Analyze risk on a multi-period basis to capture the speed of yield curve changes and the associated impact on asset and liability cash flows and reinvestment risks.
Case study example: Life insurance asset allocation review
Faced with an inverted yield curve, our example insurer has been running a portfolio of relatively short-duration Treasury and investment-grade corporate bonds, such that the asset duration (ca. 5 years) is substantially less than the liabilities (ca. 10 years).
In this example, we consider a range of different asset allocation rebalancing strategies, all of which involve adjusting the asset duration and credit exposures.
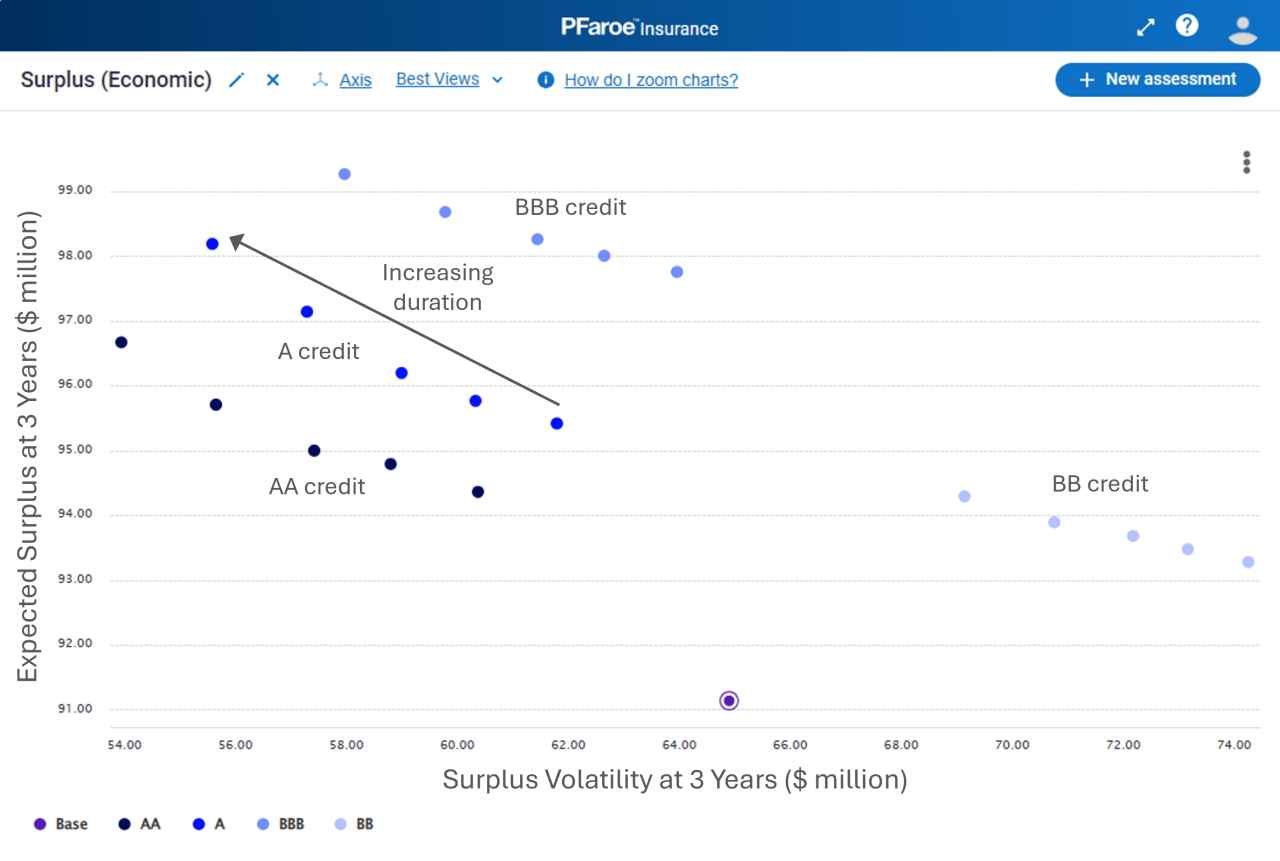
First, Figure 4 shows how increasing the credit risk exposure increases the expected surplus position over three years. We can see that for ratings of AA to BBB, there is a significant increase in the surplus; combined with an adjustment to the duration to better match liabilities, the surplus risk (volatility) has been reduced. This is in stark contrast to high-yield (BB) credit where the increase in surplus is less, and risk increased.
Figure 4: Comparing asset strategies risk and return using surplus at three years
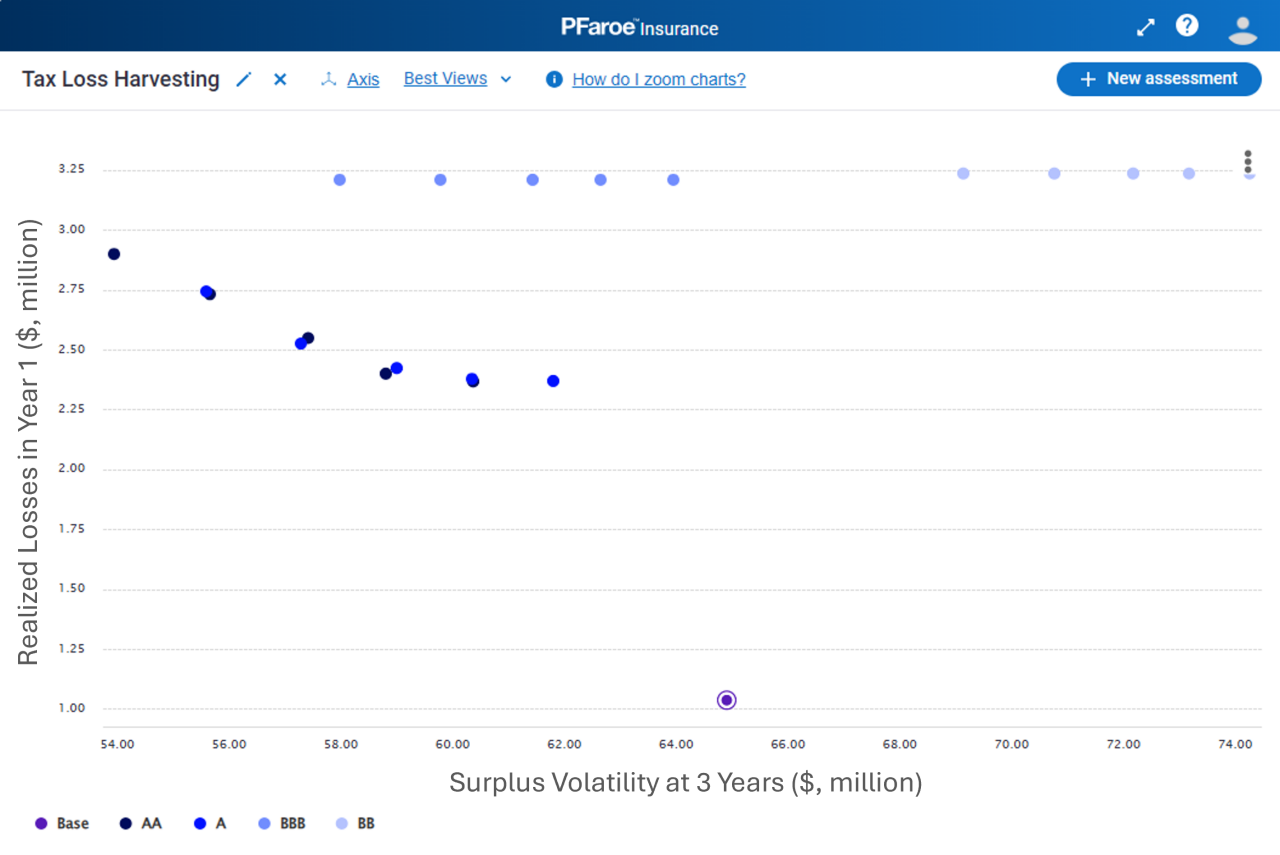
In a higher rate environment, rebalancing the duration and credit position may involve selling bonds that are trading at a discount to par value. In Figure 5, we consider the losses that will be realized by selling bonds to achieve these various target asset allocations. We can see that realized losses in the current year will increase by $1 million as we increase the target duration and reduce the credit rating. This reflects the scale of asset disposals required to achieve the target asset mix. This analysis allows us to assess the impact on realized losses and tax liability for any possible asset allocation and rebalancing strategy.
Figure 5: Comparing expected realized losses in Year 1 across different asset strategies
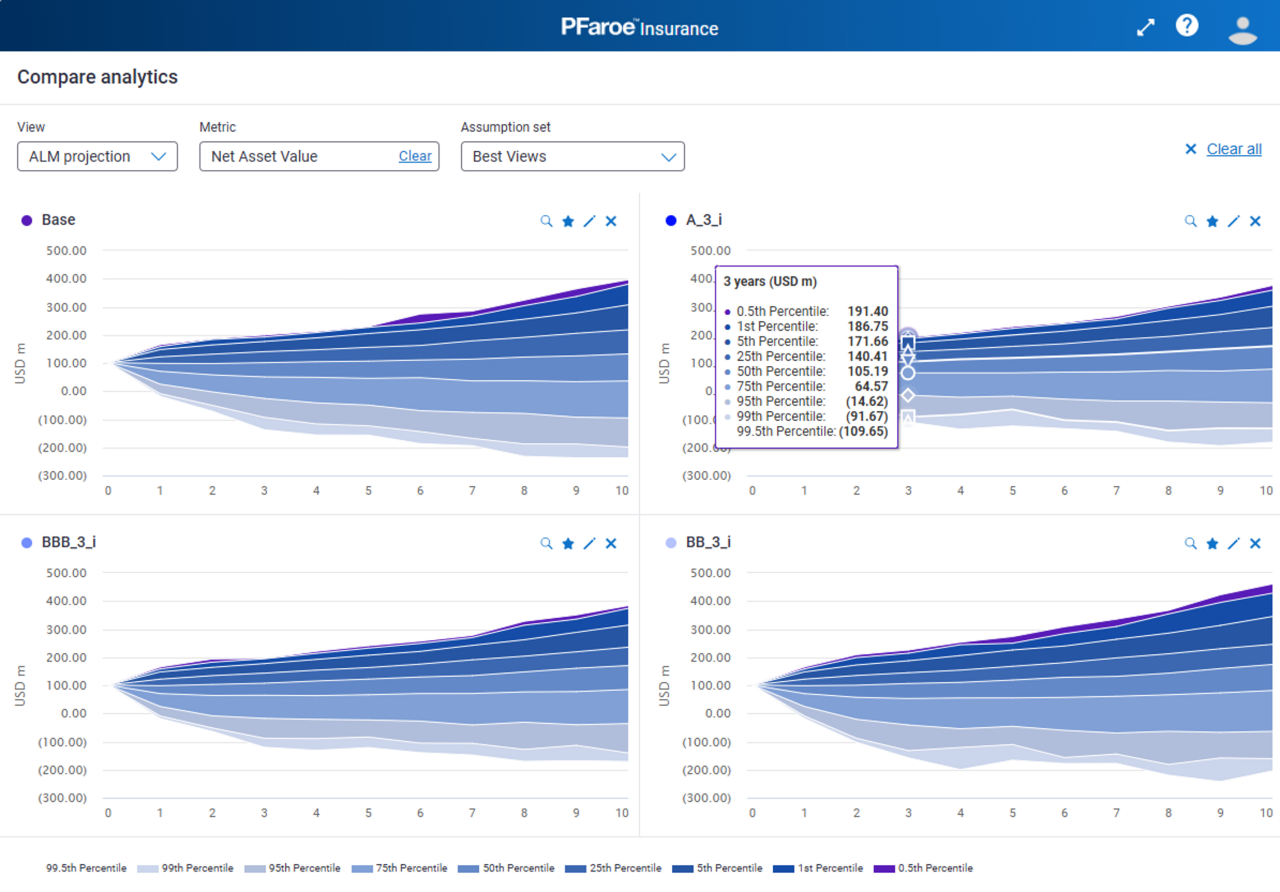
Using stochastic macroeconomic scenarios, we are able to assess the risk in any strategy across a range of different capital market scenarios over a multi-period horizon. Considering tail outcomes can give us an immediate picture of how key ALM metrics such as surplus, income, net cash flow, and capital may evolve as well as the downside outcomes associated with each strategy.
For example, in Figure 6, we can see that for longer-duration AA- and BBB-rated strategies both the median surplus and lower tail outcomes are higher than for the current “base” portfolio. By adjusting the cash flow profile of the asset portfolio to more closely reflect the liabilities, the associated reinvestment risk has been significantly reduced. However, moving further down into high-yield credit significantly increases the downside tail risk (lower right panel).
Figure 6: Distribution of outcomes under a range of macroeconomic scenarios
Transition to alternative credit
Many insurers may use the current environment to accelerate a transition to diversifying or higher-yielding assets, such as private market or structured credit.
Given the variable credit outlook for different segments of the credit market, it is important to have robust, data-driven analysis to support the transition to alternative credit asset classes and also to manage the implementation of these strategies in accordance with an insurer’s capital.
In Figure 7 below, we have taken Figure 4 and extended to various strategies including other alternative credit asset classes: commercial real estate debt, mortgage-backed securities, emerging markets debt, private credit, and infrastructure.
Figure 7: Extending the risk-return analysis to alternative credit strategies
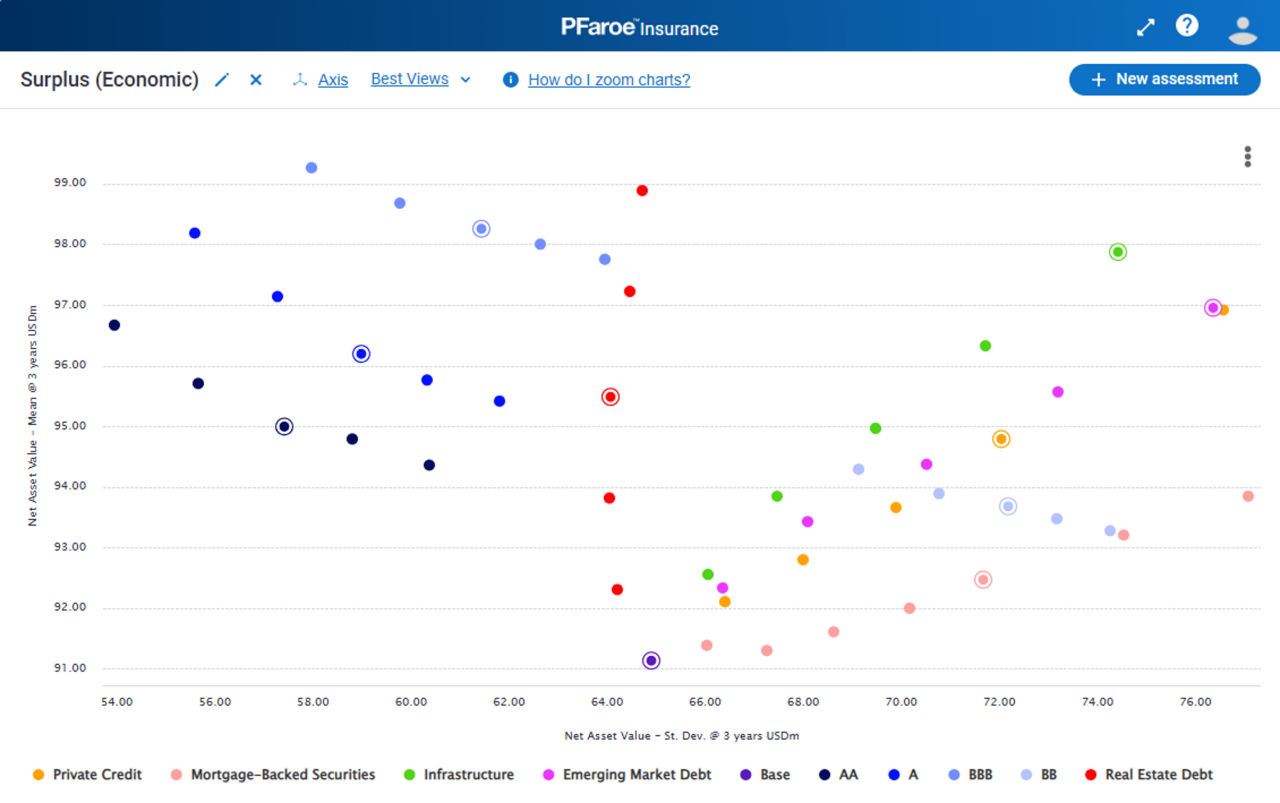
Table 1 below summarizes selected ALM risk metrics for a subset of these strategies, allowing an insurer’s asset allocation team to gain a richer understanding of these strategies’ characteristics. This makes it quick and easy to identify multi-asset strategies that not only maximize asset yield or return but are also optimized against other key financial objectives and risk constraints.
While this simple example studies the marginal impact of different duration, rating, and credit segment exposures, the models and analysis allow us to optimize the asset mix across segments, duration, and rating.
Table 1: Summary of key results for different credit and duration strategies
| % Allocation | Duration (Years) | Asset return | Surplus ($ million) | Realized loss in Y1 | Investment income | RBC ratio (%) | |
(% pa) | Lower 95% | Median | ($ million) | ($ million) | ||||
Base Portfolio |
| 5 | 4.5 | -26 | 101 | 1 | 24 | 560 |
AA Mid | 50% | 6.5 | 4.8 | -13 | 104 | 2.5 | 25 | 540 |
AA Long | 50% | 7.5 | 4.9 | -5 | 105 | 2.9 | 26 | 550 |
A | 50% | 6.2 | 4.9 | -15 | 105 | 2.4 | 28 | 480 |
BBB | 50% | 6.1 | 5 | -18 | 108 | 3.2 | 30 | 420 |
BB | 50% | 5.9 | 5 | -41 | 107 | 3.2 | 35 | 280 |
CRE Debt | 30% | 5 | 4.7 | -18 | 107 | 2.5 | 17 | 150 |
EM Debt | 20% | 3.8 | 4.9 | -41 | 104 | 2 | 19 | 190 |
Infrastructure* | 20% | 3.8 | 5 | -31 | 108 | 2 | 32 | 190 |
Private Credit* | 20% | 3.8 | 4.8 | -32 | 105 | 2 | 29 | 200 |
*Index
Leveraging advanced analytics for strategic asset allocation in a dynamic market
Moody’s modeling and analytics solutions can help insurers navigate a complex and uncertain capital market environment to effectively review and optimize investment strategies across a wide range of asset classes.
The example shown here illustrates how sophisticated multi-asset risk analytics allow an insurer’s investment team or investment partners to embed insurance balance sheet risk metrics into their asset allocation and optimization framework. Since the models and assumptions underpinning this analysis are regularly updated, portfolios can be regularly reviewed and re-optimized against changing macroeconomic conditions and forecasts.
LEARN MORE
What is Next?
Name or segment concentration analysis can help not only with regulatory but also business needs by managing credit for the institution and planning portfolio strategies in line with the risk appetite.
To learn more about how Moody's can help you manage concentration risk in your credit portfolio effectively, visit Moody's.